Posts

Personal Finance Hacks

Image
  Personal Finance Hacks Invest in yourself Invest your time, money and energy that support your financial growth.  Upgrade yourself. Start investing early When you start early you have a longer time to build a corpus. Early investment leads to compounding returns. Make a budget It is a plan to decide how much you will spend your money each month. It helps you to see where your money is going. Keep debts away Live a debt-free life for mental peace. This debt-free life will give you the bandwidth to take new financial responsibility. Build a contingency fund An emergency fund is a key component of good financial plan. Ideally, you should keep aside the amount equivalent to at least 6 months' expenses as an emergency fund.     

ONGC

Image
ONGC                                                             Technical Analysis Stock Name: ONGC Trend: Bullish, Trading in Channel Bank of Baroda: Ready to touch resistance level (143)                                      Support  level is (132) Technical Pattern: Channel Trading Directional Index (Momentum): Positive MACD: Positive crossover Volume: Positive Disclaimer :  This analysis is purely for educational purpose and does not contain any recommendation. Please consult your financial advisor before making any financial decision.

What is Technical Analysis

Image
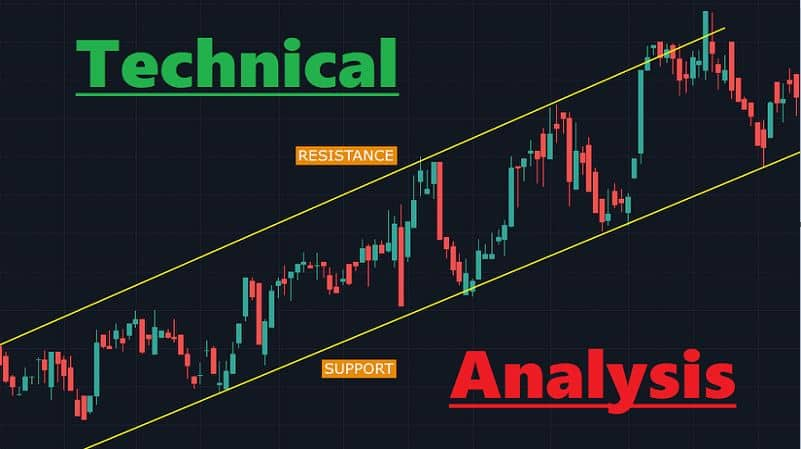
 Technical Analysis  Technical Analysis is the method to predict future prices. Prices refer to the combination of open, high, low and close of a particular security in a specific timeframe. Technical Analysis is applicable to stocks, commodities, futures, indices etc. Prices are determined in technical analysis on the basis of demand and supply(volumes) Future prices are predicted on the basis of historic price, volume, and open interest. To predict future price movement we need charts, patterns and indicators. Different time frames can be used in technical analysis i.e. 1 min, 5 min, 15 min, 30 min, hourly, daily, weekly, and monthly. Technical analysis help investors to anticipate what is likely to happen to price over time.

Bank of Baroda

Image
Bank of Baroda                                                             Technical Analysis Stock Name: Bank of Baroda Trend: Bullish, Trading in Channel Bank of Baroda: Ready to touch resistance level (130)                                      Support  level is (100) Technical Pattern: Channel Trading Directional Index (Momentum): Positive RSI: Trading in channel Volume: Positive Disclaimer : This analysis is purely for educational purpose and does not contain any recommendation. Please consult your financial advisor before making any financial decision.

Benefits of Technical Analysis

Image
 Benefits of Technical Analysis It helps to select stocks and commodities for trading. It helps to identify trends. It helps to find the strength in trends. It helps when to buy and sell a stock or a commodity. It helps to minimize risk. It helps to generate profit in intra-day, short term and long term. It helps to place a stop loss. It helps to find over-bought and over the sold area.

Recession

Image
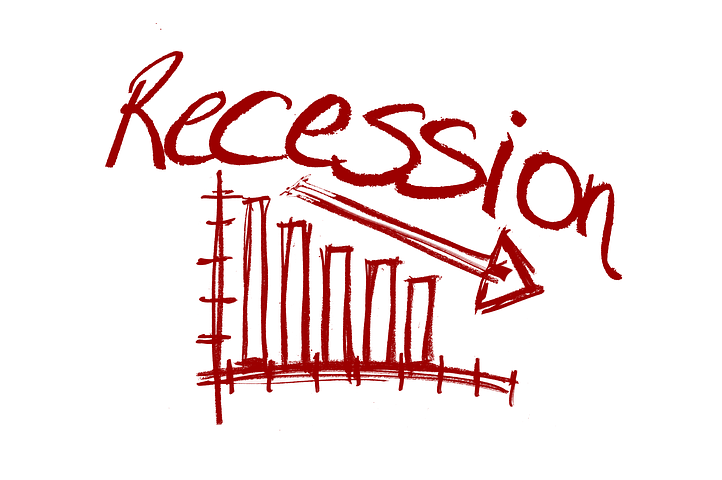
RECESSION India has zero probability of slipping into recession in the next year. While other economies, including Asia, Europe and the US face the risk of crisis.  A global pandemic, a war between two nations and a breakdown in the supply chain system resulted in sky-rocketing inflation. The global recession is just around the corner. India's Recession Probability is ZERO.

Technical Analysis

Image
 Technical Analysis